Duet Web Control 2.0.0-RC3 is ready
-
@chrishamm said in Duet Web Control 2.0.0-RC3 is ready:
@kraegar Drag&drop is supported in the Files category. If you want to move a file up, drag&drop it on one of the directory links at the top.
Hm, just tried this. I can drag files around all day but dropping does not work. It will just stop the dragging animation but the files stay where they were.
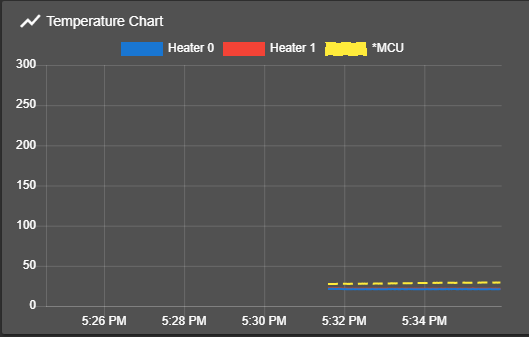
EDIT: And another thing I just realized: if you have a larger amount of extra temperature sensors they will mess up the layout:
Initially loaded it looks like

Then switching to Extra looks like (which is still OK)

But then going back to Tools leaves empty space and an extended temp graph:

-
@chrishamm said in Duet Web Control 2.0.0-RC3 is ready:
@Edgars-Batna DWC2 uses a UI framework that follows material design and on Android the order of buttons is different from Windows. Did you have a tool selected when you tried to extrude?
I see no point following any specific designs. The GUI should be fit for a purpose and for a semi-industrial machine that can get damaged or can rip your fingers off there should NEVER be a change like this which reverses order of the buttons in potentially security related dialogs.
Yes, I tried multiple things, including selecting a tool and enabling cold extrusion.
In general CORS errors are equivalent to network errors. When running DWC2 on localhost and it tries to connect to another machine, the browsers do a CORS preflight check (by sending an OPTIONS request to the host to see if the other request would be actually permitted) and if that fails, DWC2 reports a CORS error. I may simplify this a bit more so that it shows 'Network error' instead of 'CORS error' when running on a Duet.
Then it must be a firmware issue, because my network is solid and the problem started right after updating to 2.02 and new web UI.
All in all I understand the move to vue.js as I've been involved with it at work. At the same time these machines that are used to produce stuff can't be put into same baskets with Farmville. I'm exaggerating, but there's just no comparison. It's my rationale, but it's up to you to decide.
-
@chrishamm The messages produced by macros are not being displayed on screen or in the console on this release but if I revert to the old screen everything works correctly.
It took a bit of getting used to not being able to drag and drop, I would prefer if this functionality could be restored in addition to the way it works now. -
Apologies if this has already been mentioned but I think there's a problem with the layer time chart. It appears to work OK at the start but then later it goes blank. I noticed when I reprinted a job that the second (and subsequent) prints did not have a layer time chart displayed.
-
@burtoogle said in Duet Web Control 2.0.0-RC3 is ready:
Apologies if this has already been mentioned but I think there's a problem with the layer time chart. It appears to work OK at the start but then later it goes blank. I noticed when I reprinted a job that the second (and subsequent) prints did not have a layer time chart displayed.
I mentioned this above somewhere. This can already happen within the same print by switching to another section of DWC and then returning to Job Status. At least in this case reloading DWC solves the issue.
-
@wilriker said in Duet Web Control 2.0.0-RC3 is ready:
This can already happen within the same print by switching to another section of DWC and then returning to Job Status.
Yes, I think I had seen that behaviour also but couldn't remember for sure.
-
@chrishamm By speed graphing, I mean the ability to see the speed of the printer over time, on the UI, just like the temperature graph. This is really useful for debugging because the instantaneous readout can be hard to keep up, and just knowing how fast the printer is going can be useful for debugging slicing and machine settings. Plus if you change these settings but want to run an older g-code file it can be handy too.
I did take a look at the code and it seems pretty reasonable to add, but I doubt this is something I'd work on anytime soon.
-
I could not find, if somebody already mentioned it, but in Europe the time (in the temp chart) is not displayed in "AM/PM" format. Maybe make it selectable, thanks.
-
@biggsis said in Duet Web Control 2.0.0-RC3 is ready:
I could not find, if somebody already mentioned it, but in Europe the time (in the temp chart) is not displayed in "AM/PM" format. Maybe make it selectable, thanks.
I got AM and PM in my Temp Chart.

-
I finally got around to trying this out and thought I'd share my (very early) initial impressions. These are my own impressions without taking into account things that others might have posted. While this type of feedback might result in duplicate comments, it also prevents my impressions from being "contaminated" by what I might have already read. I'm using the "Chrome" web browser on Windows 10 and MacOS against firmware 2.02. and DWC 2.0.0-RC3
First, I like what I think you're trying to do here. Overall, it looks positive.
However, I encountered three items that I feel are steps backward.
It's more clumsy now than it was to initiate the G32 command (delta calibration, manual bed leveling assistant, etc. It runs G32.) Previously, it was a simple single button click on the primary/dashboard screen. Now, it requires multiple clicks to first drop down the "compensation & calibration" list, a mouse movement, and a second click to select the proper option. This is more annoying when you consider that "mesh" compensation isn't used on my machine and isn't enabled. (There's no mesh area defined.) To resolve this, I'd suggest reverting to the simple single function button by default and allowing an option to change this to the droplist if and only if a selection is made in the settings to enable mesh options. (Or, only present mesh options if a mesh area is defined, otherwise just be a simple button that runs G32.)
Related to the above, when I run G32 using the Compensation&calibration droplist from the Dashboard, the results of the calibration do not seem to appear in the "G-Code Console" tab. I usually check the output of a calibration to ensure that the before/after numbers are somewhat close to each other (and re-run g32 if they aren't.) It seems (with DWC 2RC3) that the only way to get the G32 results to appear in the console is to run the command from the console tab to begin with.
I'm not sure I like how the status/tools/temp layout renders. I get a LOT of empty whitespace and the temperature chart (which is the tallest window) gets squeezed on the far right. I've posted a screen snippet near the end of this post to illustrate the concern. Possible alternatives might be to limit the height of the temperature chart to be no higher than the max height of the status or tools box (whichever is taller) or stack the status and tools boxes over each other (which would work for single tool/single bed machines, but might be annoying for multiple tool machines.)

-
I would concur ref the results of a auto cal routing from the drop down no results are displayed doing a G32 from the Gcode console works
-
@as-3d-druck said in Duet Web Control 2.0.0-RC3 is ready:
@biggsis said in Duet Web Control 2.0.0-RC3 is ready:
I could not find, if somebody already mentioned it, but in Europe the time (in the temp chart) is not displayed in "AM/PM" format. Maybe make it selectable, thanks.
I got AM and PM in my Temp Chart.

Re-reading his post I think there may be a slight language issue. I think he was asking for the temp chart time display to be selectable between the am/pm style and the (more favoured in Europe) 24 hour style.
FWIW I would also prefer to see 24 hour time.
-
Is the temp chart fixed to 300C max?

I am printing with PC at 300C. It would be nice if it could autoscale the max value. -
@dragonn I think it's supposed to scale with whatever you have your max temp set to?
-
@phaedrux said in Duet Web Control 2.0.0-RC3 is ready:
@dragonn I think it's supposed to scale with whatever you have your max temp set to?
I have in my config:
M143 H1 S350So it doesn't look like it is working this way.
-
@dragonn I guess that's how it was supposed to work on the v1 DWC. Here's where I remembered seeing it. https://forum.duet3d.com/topic/2969/allow-scrolling-resizing-and-scaling-of-the-temperature-graph
-
@phaedrux said in Duet Web Control 2.0.0-RC3 is ready:
@dragonn I guess that's how it was supposed to work on the v1 DWC.
I checked the source code for DWC2 and it is supposed to work the same way. 300°C is the default max but can be overridden by the machines highest temperature. Obviously something is not working as intended.
I have though found another issue: I have a macro that more or less does the same thing as a
G32for assisted bed leveling would do. It takes to my adjustment screws and displays a Z movement dialog. In this dialog I can click every button exactly once. Then it turns into a spinner and can no longer be used.
It only happens withM291inside the macro. If I runM291directly via GCode input field it works as expected.Here is my macro
G28
G0 F6000
G0 Z2
G0 X7 Y110 ; Middle-left
M291 S3 Z1 R"Leveling Phase 1" P"Level point 1/3 and press OK"
G0 Z2
G0 X215 Y3 ; Front-right
M291 S3 Z1 R"Leveling Phase 1" P"Level point 2/3 and press OK"
G0 Z2
G0 X215 Y215 ; Back-right
M291 S3 Z1 R"Leveling Phase 1" P"Level point 3/3 and press OK"
G0 Z2
G0 X215 Y3 ; Front-right
G0 Z0
M291 S3 Z1 R"Leveling Fine-tuning" P"Fine-tune point 1/2 and press OK"
G0 Z2
G0 X7 Y110 ; Middle-left
G0 Z0
M291 S2 Z1 R"Leveling Fine-tuning" P"Fine-tune point 2/2 and press OK"
P.S.: Same behavior when running
G32. I do not have a probe so I useM558 P0to use manual mode.P.P.S.: As with
G32when used on a Delta it will also not report required adjustments forG32assisted bed leveling. -
This post is deleted! -
I cannot see how I can pin/lock/override the fan speed..
-
I'm finding that with DWC 2.x on my Maestro the DWC will stop working without affecting the print. And it eventually returns. Is there a know issue that kills the web server, but it eventually recovers? The page just stops being served and then starts again eventually. I tend to use the reprap link. I recall reading discussions about buffer overflow in the web server?