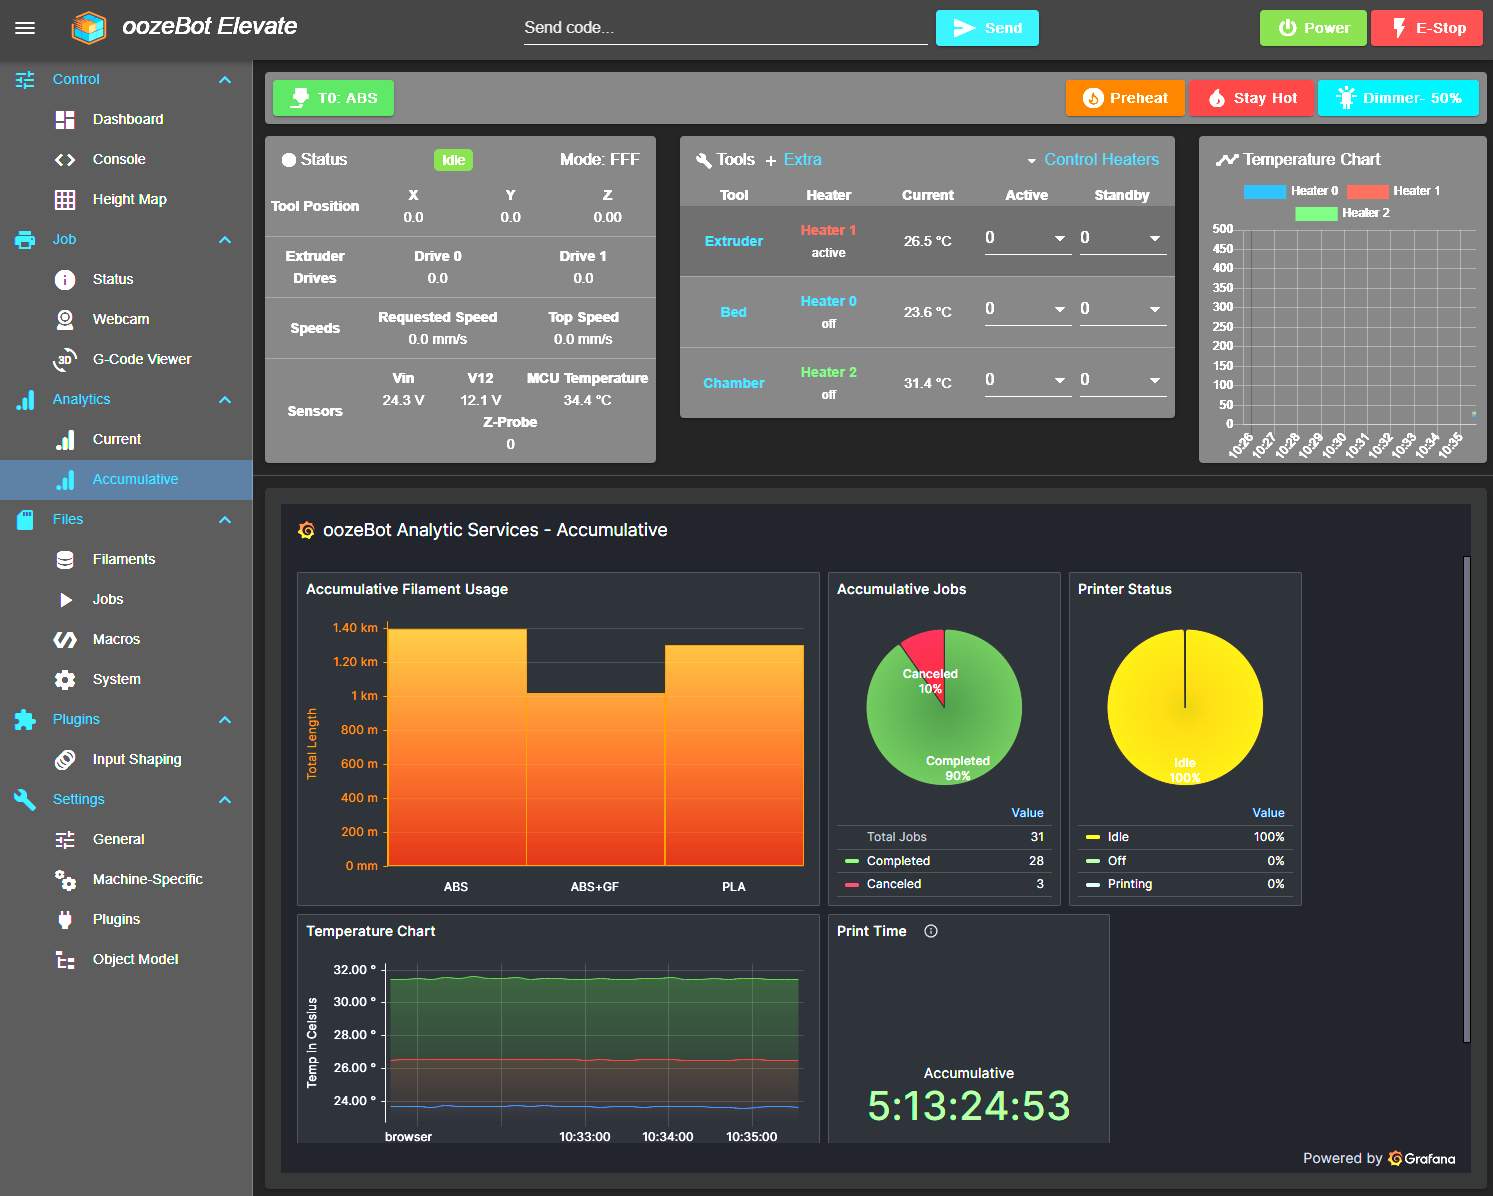
Analytic Services - custom DWC
-
We thought we'd throw out our latest mod to DWC - Analytics. This is accomplished through DSF-Python scraping the objectModel and dumping data into a mySQL database which runs directly on the Raspberry Pi. Grafana is also installed on the Raspberry Pi, making this a complete stand-alone solution. This is tied very closely to our framework, so its not a drop-in replacement for the stock DWC builds - but the source will be posted to our github once complete for anyone who is interested in seeing how we did it.
We've split this into two dashboards: Current (based on the time window selected in Grafana), and Accumulative. You can see the new menu options on the left.
The dashboard in the screenshot is in very early development, but you'll get the gist. Want to know how many jobs your machine has ever completed? and how long it took? How about the total length/weight/cost of each filament used? etc, etc, etc..
We are tossing it out there for feedback on other metrics that would be valuable to capture. @chrishamm @Falcounet - we'd like to also capture quite a lot of metrics which only appear to be available through M122 such as CANbus values. Is there a clean way to read these values in DSF-Python? And how often is it safe to call M122?

-
@oozeBot Did you see my post here? https://forum.duet3d.com/post/327001
Ian
-
@droftarts No - I had missed that post. Thanks! Great minds think alike..

It mentions scraping the objectModel like we are doing.. but not certain what storage your example uses, etc. I'm also quite interested in scraping additional metrics from outside the objectModel (results of M122, etc). Do you know if your example is doing anything like that?
-
@oozeBot said in Analytic Services - custom DWC:
It mentions scraping the objectModel like we are doing.. but not certain what storage your example uses, etc.
Neither am I! I'm waiting for more details, and hopefully a write up, from Andy.
I'm also quite interested in scraping additional metrics from outside the objectModel (results of M122, etc). Do you know if your example is doing anything like that?
As far as I know, no, we don't do that. Worth asking @dc42 if there's an easy way to do that.
Ian
-
@oozeBot which CAN bus values do you want? We're considering adding some (e.g. error counts) to the OM.
-
@oozeBot Cool to have it as a plug in, by the way!
Ian
-
@dc42 Great to hear you considering expanding the objectModel with additional fields. TBH - you know way better than us on the metrics which would most useful. Anything that provide really "meaty" metrics is what we are after. Such as the health of the CAN bus connected devices (lost packets, waits, jitter, etc). I can also see the value in capturing hiccups, step errors, etc from Move unless I'm misunderstanding the metric.
Moves scheduled 1923222, completed 1923222, in progress 0, hiccups 0, step errors 0, maxPrep 0, maxOverdue 0, maxInc 0, mcErrs 0, gcmErrs 0
Peak sync jitter -1/5, peak Rx sync delay 216, resyncs 0/0, no step interrupt scheduled
VIN voltage: min 24.1, current 24.1, max 24.1
MCU temperature: min 43.2C, current 51.5C, max 81.0C
Last sensors broadcast 0x00000006 found 2 72 ticks ago, 0 ordering errs, loop time 1
CAN messages queued 1377461, send timeouts 0, received 604725, lost 0, free buffers 37, min 37, error reg 0
dup 0, oos 0/0/0/0, bm 0, wbm 0, rxMotionDelay 0
Accelerometer: LIS3DH, status: 00
I2C bus errors 0, naks 0, other errors 0
We are also interested in capturing the health between the 6HC and the SBC:
=== SBC interface === Transfer state: 5, failed transfers: 0, checksum errors: 0 RX/TX seq numbers: 13044/13044 SPI underruns 0, overruns 0 State: 5, disconnects: 0, timeouts: 0 total, 0 by SBC, IAP RAM available 0x2ab5c Buffer RX/TX: 0/0-0, open files: 0 -
@oozeBot Just for reference, we collected 5.7GB of data from the Formnext show! That was just 3 machines, and only running for 4 days when the show was open, not even 24hrs, but we were capturing everything (that changed) 4 times a second. So being selective about what you capture if you're running a lot of machines seems quite important.
Ian
-
@droftarts What we've created is running on each instance/machine. And currently, we are polling every 5 seconds and selectively storing only what will be used in relational database tables. I flushed the database a little over a week ago and it's currently only ~3mb! So we are obviously ignoring a ton of the fields within the objectModel..
-
@oozeBot That sounds simpler! I remember Andy saying we save it in a time-series database, rather than a relational database, as it makes looking up faster. But I don't really know what that means... I know we're using the REST API to grab the data from the Duet, and Grafana to query the database. I'll try and get some more details from Andy next week.
Ian
-
@droftarts my understanding is that currently we are capturing any data that changes and might reasonably be of interest every 250ms, and then choosing which data to display. That would account for why we collected so much!
-
@droftarts Appreciate it. What we have built is also time-series but with the addition of joining tables where applicable to dive in deeper.
Good to know its safe to poll the objectModel that rapidly! We were a bit concerned with doing it every 5 seconds!