Accelerometer Usage
-
Reading one less sample doesn't help. I can only assume that communicating with the accelerometer creates an electrical disturbance that slightly affects the reading.
-
@dc42 said in Accelerometer Usage:
Reading one less sample doesn't help. I can only assume that communicating with the accelerometer creates an electrical disturbance that slightly affects the reading.
If you read only 10 samples at a time, do the peaks appear at that new interval?
-
@ccs86 said in Accelerometer Usage:
@dc42 said in Accelerometer Usage:
Reading one less sample doesn't help. I can only assume that communicating with the accelerometer creates an electrical disturbance that slightly affects the reading.
If you read only 10 samples at a time, do the peaks appear at that new interval?
I didn't try that. I did find that the LIS3DSH has smaller peaks are multiples of 20 samples than the LIS3DH.
-
-
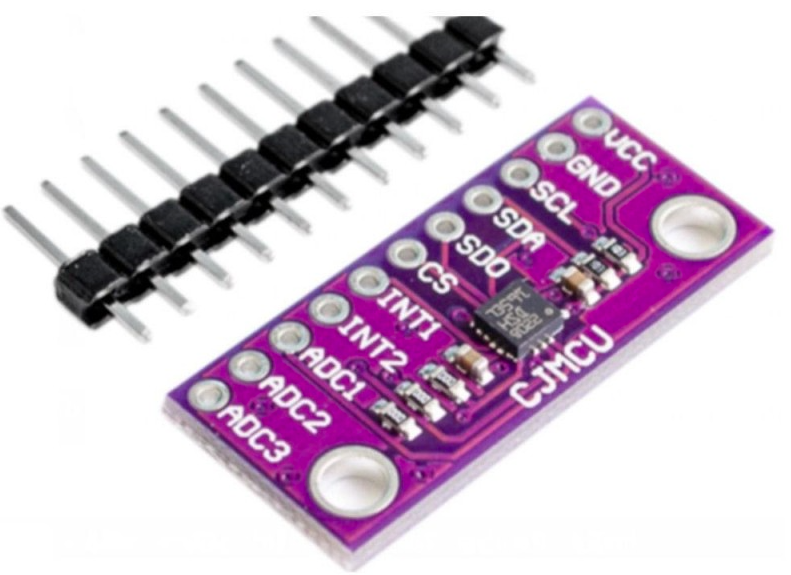
@tecno yes, that's the LIS3DSH board that I tested with.
-
Thanks !
-
G1 X-20 G4 S2 M956 P121.0 S1000 A0 G4 P10 G1 X50 F20000Error: M956: Accelerometer is already collecting data
gives an error message
Duet 3 3.4.0-b2
DSF
Tool Board 1.1 -
@sotidii please send M115 B# where # is the CAN address of the tool board, to verify the tool board firmware version. There was a bug with similar symptoms in unofficial beta builds of the tool board, but it was fixed in the official beta release.
-
@dc42
M115 B 121
FIRMWARE_NAME: RepRapFirmware for Duet 3 MB6HC FIRMWARE_VERSION: 3.4.0beta2 ELECTRONICS: Duet 3 MB6HC v0.6 or 1.0 FIRMWARE_DATE: 2021-08-03 12:42:44 -
@sotidii said in Accelerometer Usage:
@dc42
M115 B 121
FIRMWARE_NAME: RepRapFirmware for Duet 3 MB6HC FIRMWARE_VERSION: 3.4.0beta2 ELECTRONICS: Duet 3 MB6HC v0.6 or 1.0 FIRMWARE_DATE: 2021-08-03 12:42:44Run the command again, but don't put a space between the B and the 121.
-
@dc42
M115 B121
Duet TOOL1LC firmware version 3.3RC3 (2021-05-26 12:30:20) -
@sotidii said in Accelerometer Usage:
Duet TOOL1LC firmware version 3.3RC3 (2021-05-26 12:30:20)
Please upgrade the tool board firmware to version 3.4beta2.
-
@dc42 OK!
-
@dc42 said in Accelerometer Usage:
@ccs86 said in Accelerometer Usage:
@dc42 said in Accelerometer Usage:
Reading one less sample doesn't help. I can only assume that communicating with the accelerometer creates an electrical disturbance that slightly affects the reading.
If you read only 10 samples at a time, do the peaks appear at that new interval?
I didn't try that. I did find that the LIS3DSH has smaller peaks are multiples of 20 samples than the LIS3DH.
Is eliminating these false peaks something you plan on pursuing? It seems like they have the ability to skew the analysis.
I tried manually removing the peak samples from a copy of one of my logs, for the purpose of comparing the analyzed result. But while the modified log is displayed correctly in DWC, the analysis always shows a blank chart.
-
@ccs86 said in Accelerometer Usage:
Is eliminating these false peaks something you plan on pursuing? It seems like they have the ability to skew the analysis.
I have already looked into it, and come to the conclusion that reading the data is what caused the spurious peaks. Apart from avoiding wires running very close to the accelerometer chip, I don't think much can be done about it, except perhaps randomising the times at which data is read.
The spurious peaks I see from my LIS3DH accelerometers are very much lower than in your plot, and even lower for my LIS3DSH accelerometer. Perhaps you have either a bad accelerometer, or a wire running right over the chip or right under the PCB.
-
@dc42 said in Accelerometer Usage:
The spurious peaks I see from my LIS3DH accelerometers are very much lower than in your plot, and even lower for my LIS3DSH accelerometer. Perhaps you have either a bad accelerometer, or a wire running right over the chip or right under the PCB.
In the graph I posted, the Y axis scale was between 1.15 and 0.85. Your graph was 1.2 to -0.2. That is a vertical compression of 4.66 times, which visually downplays the peaks.
Even if yours don't have quite as much amplitude, they are still erroneous data on up to 5% of the samples taken. To me, that surely need to be addressed if you want accurate analysis.
-
@ccs86 if you use the Analyse button, I think you will see that the energy in those spurious peaks is much lower than the energy in genuine ringing. Nevertheless, if this proves to be a problem then I will look at randomising the read times somewhat to spread the spectrum out.
-
One could apply a statistical hack if one really knows the problem is every 20 samples, and either the first or last sample in a batch. One can just replace the (known) bad point with the average of the point before and after. This doesn't change the power spectrum significantly. This is equivalent to adding a random Dirac comb of small amplitude (the difference between the correct, missing point and the average) to the data, which has only a very weak effect on the spectrum. The noise floor at frequencies which are harmonics of (sampling rate / 40) will be slightly raised.
-
@dc42
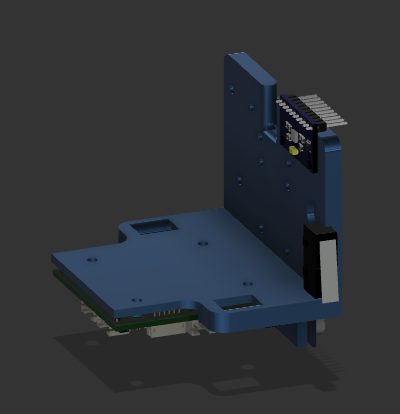
How critical is the way the board is mounted?
Above picture is a mockup with another accelerometer.
As I am only going to use only X axis in this case does it really matter how it is mounted?
-
@mendenmh said in Accelerometer Usage:
One could apply a statistical hack if one really knows the problem is every 20 samples, and either the first or last sample in a batch. One can just replace the (known) bad point with the average of the point before and after. This doesn't change the power spectrum significantly. This is equivalent to adding a random Dirac comb of small amplitude (the difference between the correct, missing point and the average) to the data, which has only a very weak effect on the spectrum. The noise floor at frequencies which are harmonics of (sampling rate / 40) will be slightly raised.
As a straightforward fix I think that is a great idea.
