Duet Web Control 2.1.2 released
-
Thanks. As you have been resetting DCS in this sequence, I'm not clear whether this is an issue with RRF after all. You could try to replicate the problem in standalone mode if you wish; otherwise I'll wait to see what @chrishamm says.
-
Thanks for the debug logs. In 1 you can see DCS assigns the correct filament:
[debug] Filament Filamentum PLA Extrafill has been assigned to extruder drive 0This message is generated when the filament has been updated from the firmware. In two there are a couple of updates for
move(where the assigned filament is stored) which is fine, but it does not occur when M702 is finished. So I believe RRF increases the seqs.move field before M702 has fully finished, hence the updated filament never makes it to DCS. So when you restart DCS as per 3, it queries the full object model again before it does anything else, hence the filament is displayed properly again.The same issue may be present in standalone mode, but in any case I'll have a look at it, try to reproduce, and fix it.
-
Hi
Do not know or understand if this is related or not to the above problem but I still have problem that loaded filament "jumps" tool when cancelling a print... (commented on it in 2.11 release thread)

This was loaded on T1 and after I cancelled the print it jumped. Normal end of print does this to but when the printer is allowed to finish by it self both tools has no filament loaded.
Since it do not stop me from using my printer (most prints are successes) this is more an annoyance than a stopper but if I can help in pinpointing the problem or verify the fix please just ask.
Thanks for all the good work.
-
@chrishamm @dc42
Thanks both for looking into this.I'll have a go at running in standalone later but for now, as per @dc42 original request. Here are two further logs with details of what state things show.
- Immediately after a print finished, M701 DWC and filaments.csv all correctly show that filament is loaded (I'm certain that at the start of the print DWC and .csv were wrong, but I didn't see when it changed - presumably during the print, but I don't know why).
- I then used the drop down option on DWC to unload the filament and immediately copied the log: 4.txt
- At this point DWC incorrectly shows filament loaded, M701 is correct and filaments.csv is incorrect
- Since M701 was showing correctly that there was no filament loaded, I used it again with the S parameter to manually load the next filament. Immediately after pressing enter on this in the console i noticed DWC corrected itself to showed no filament loaded checking .csv also showed that had now updated - I did this while waiting for heat up so at this point the new filament hadn't loaded.
- After filament load, DWC incorrectly shows filament not loaded, M701 is correct again and .csv is incorrect. HEre is the log immediately after the load: 5.txt
- Started the next print with DWC showing no filament loaded, but something clearly knows it is at it used the filaments config file during the print's start code.
Hope this helps. As i said, I'll try standalone later, but if there's anything else you want me to try, just let me know.
-
The issue of fans not working properly in DWC when the fan was configured with an "X" parameter is confirmed resolved with DWC 2.1.2. Thank you.
-
Simulation times for me aren't getting shown in the jobs list once the simulation is completed. This was on a duet 3 with SBC running RC7 and DSF 1.3.2
I haven't tried on a duet 2 yet.
-
@jay_s_uk Simulation times show for me on Duet 2 Wifi and Duet 2 Maestro (RRF 3.01-RC7, DWC 2.1.2).
Ian
-
DWC 2.1.2 running in Chrome under Win10 w/ Duet3 (standalone) 3.0.1 RC7:
I'm finding at times that the "last layer time" isn't being updated on the status page under some conditions.
One place I think replicates this is if the computer running DWC goes into standby, and then I wake the machine while I print is in progress. The status page layer times runs "catchup" for a second, but the "last layer time" gets stuck at some time that seems to be similar to the "Job Duration" time.
At that point, the "current layer time" updates as expected, and goes back to zero on layer changes, but the "last layer time" never changes.
The "layer chart" also appears to get out of whack.
(I'm really hoping you can replicate this, because I'm at a loss for words to describe it properly.)
If I refresh the browser window, everything starts working again.
-
@garyd9 Thanks for reporting this, I suspect one place in DWC2 that could cause this behaviour. Can you please test this new build and let me know if the problem is gone? https://www.dropbox.com/s/znzevo862ny7kr6/DuetWebControl-SD.zip?dl=0
-
@jay_s_uk said in Duet Web Control 2.1.2 released:
Simulation times for me aren't getting shown in the jobs list once the simulation is completed. This was on a duet 3 with SBC running RC7 and DSF 1.3.2
I believe @chrishamm said it's a known issue that DSF doesn't yet write the simulated time to the end of the GCode file.
EDIT: it's listed at https://github.com/chrishamm/DuetSoftwareFramework/tree/dev#known-issues.
-
Thanks for that. Didn't realise there was a separate known issues list.
It would be helpful if a central list was maintained. -
@jay_s_uk said in Duet Web Control 2.1.2 released:
Thanks for that. Didn't realise there was a separate known issues list.
It would be helpful if a central list was maintained.Yes it is a bit hard to find. We're going to standardise release documentation so that known issues are always easy to find.
-
@chrishamm said in Duet Web Control 2.1.2 released:
@garyd9 Thanks for reporting this, I suspect one place in DWC2 that could cause this behaviour. Can you please test this new build and let me know if the problem is gone?
Uploaded to my duet3. Will try to keep an eye out for the issue and ping back.
-
@dc42 said in Duet Web Control 2.1.2 released:
Thanks. As you have been resetting DCS in this sequence, I'm not clear whether this is an issue with RRF after all. You could try to replicate the problem in standalone mode if you wish; otherwise I'll wait to see what @chrishamm says.
So having just tried this in standalone mode, I cannot find a way to replicate the issue this way.
-
what is the way to add duet driver temperature to the chart?
this successfully adds MCU
M308 S2 Y"mcu-temp" A"CPU" ; CPU temp sensorbut this does nothing
M308 S3 Y"drivers" A"drivers" ; drivers temp sensori tried M308 S21 Y"drivers" A"Duet_drv" too with no luck
how to get drivers temperature visible?
-
If I recall, TMC drivers don't actually report temperature. They just report OK vs Nearly too hot vs Too Hot. (or conceptually similar).
So they can't be graphed. (usefully)
-
So they can't be graphed. (usefully)
true story, you'll just get 0C, 100C and 150C but it'll be in the extra tab or what its caled.
-
@chrishamm said in Duet Web Control 2.1.2 released:
@garyd9 Thanks for reporting this, I suspect one place in DWC2 that could cause this behaviour. Can you please test this new build and let me know if the problem is gone? https://www.dropbox.com/s/znzevo862ny7kr6/DuetWebControl-SD.zip?dl=0
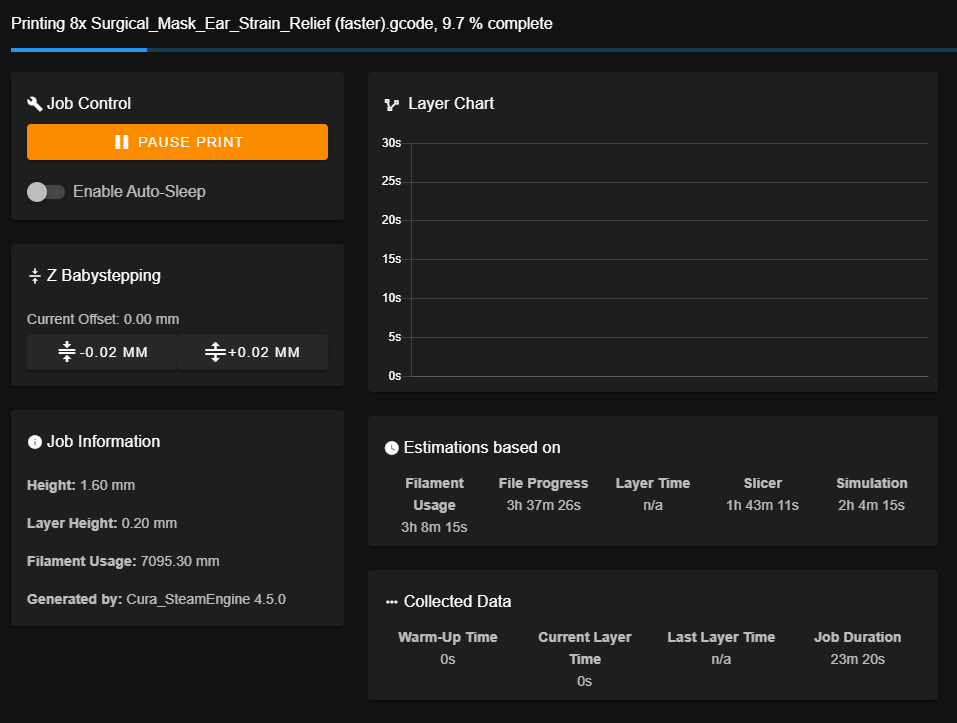
While I haven't (yet) replicated the original reported problem, here's a new one with the DWC drop your dropbox. In the image below, notice the "current layer time" of 0. (It's currently printing the first layer, so the "last layer time" is shown as I'd expect.)
Here's also the output of a M409 query. It's possible this is a case of RRF 3.0.1 RC7 reporting bad data in the object model. If so, please forward the issue to dc42. (layerTime is 0 in the json)
M409 K"job"
{"key":"job","flags":"","result":{"build":{"currentObject":6,"m486Names":false,"m486Numbers":false,"objects":[{"cancelled":false,"name":"Object 2","x":[-94.4950027,55.1020012],"y":[0.0820000,24.5779991]},{"cancelled":false,"name":"Object 4","x":[-58.9290009,90.6679993],"y":[18.8269997,43.3219986]},{"cancelled":false,"name":"Object 6","x":[-86.8740005,62.7229996],"y":[42.3479996,66.8420029]},{"cancelled":false,"name":"Object 6(1)","x":[-74.8000031,74.7979965],"y":[67.8170013,92.3130035]},{"cancelled":false,"name":"Object 1","x":[-54.9140015,94.6839981],"y":[-25.0049992,-0.5110000]},{"cancelled":false,"name":"Object 3","x":[-89.4520035,60.1459999],"y":[-43.9399986,-19.4440002]},{"cancelled":false,"name":"Object 5","x":[-29.9820004,55.7639999],"y":[-63.2210007,-52.2210007]}]},"duration":1682,"file":{"filament":[7095.3],"fileName":"0:/gcodes/PETG/No Fan/8x Surgical_Mask_Ear_Strain_Relief (faster).gcode","firstLayerHeight":0.20,"generatedBy":"Cura_SteamEngine 4.5.0","height":1.60,"lastModified":"2020-04-15T12:11:50","layerHeight":0.20,"numLayers":8,"printTime":7591,"simulatedTime":8855,"size":4515762},"filePosition":526940,"firstLayerDuration":1682,"lastFileName":"0:/gcodes/PETG/No Fan/8x Surgical_Mask_Ear_Strain_Relief (faster).gcode","layer":1,"layerTime":0,"timesLeft":{"filament":11079,"file":12736},"warmUpDuration":0}}
-
@garyd9 said in Duet Web Control 2.1.2 released:
here's a new one with the DWC drop your dropbox. In the image below, notice the "current layer time" of 0. (It's currently printing the first layer, so the "last layer time" is shown as I'd expect.)
Here's also the output of a M409 query. It's possible this is a case of RRF 3.0.1 RC7 reporting bad data in the object model. If so, please forward the issue to dc42. (layerTime is 0 in the json)Thanks for reporting this, it's a bug in RRF. Should be fixed in the internal build at https://www.dropbox.com/sh/3azy1njy3ayjsbp/AACquxr2m00eV568RZg5QG5wa?dl=0.
EDIT: the fix is included in RRF 3.01-RC8.
-
M122 does not output anything on my Duet 2 Wifi