3D GCode Viewer integrated with DWC
-
@DaBit when you change colors and hit reload it should be reloading. You may see a red circle button appear which is a cancel render button which means it is loading. If that isin’t showing up check your console with f12 and see if it is reporting any errors.
Edit : check what render mode you are in as well. On mobile I don’t recommend going past medium. On pc depending on your video card you can go higher. Another thing to try is to force line mode and see if that helps.
-
@Sindarius I had to downgrade DWC to the latest stable version because I had a lot of connection problems : connection via browser was very slow to complete and after a certain point when I entered the main page I saw all the infos but on the top there were the modal dialog displaying the progress bar and the message about connection progress wich always stayed displayed , the plugin has started correctly only twice, the third time I've connected it with the current job but no render has been started and from this moment on the DWC after a long connection showed me senseless data in the status page (4 tools when I have one, no info about the bed and so on) It has returned normal only after print reboot this morning... I don't know if this issue has been due to the yet not completely stable release of DWC or by the plugin (I suspect the first).... I'll wait a stable release of everything and then I'll give a try again
-
After initial startup and loading an external Gcode file:

So that's OK.
Now, changing the color mode from 'feed' to 'color':

The bed, axes and cursor (not enabled here) keep drawing, the GCode visualisation disappears, and no combination of options brings it back (Only a reload of the webpage does).
In the console another 'No objects' message appears, every time a redraw should happen. This seems uncritical though since the first 'No objects' message appears on initial load where I do get a visualisation.I will try DWC beta3, see if it makes a difference.
[edit]I can't; it is not available for download[/edit]Still, pretty cool stuff!
-
@DaBit said in 3D GCode Viewer integrated with DWC:
[edit]I can't; it is not available for download[/edit]
You have to click the pull down "Assets"

-
Ah yes, it is lower in the list than b2.
Anyway, it makes no difference, behaviour of b3 is equal to b4.
[edit]
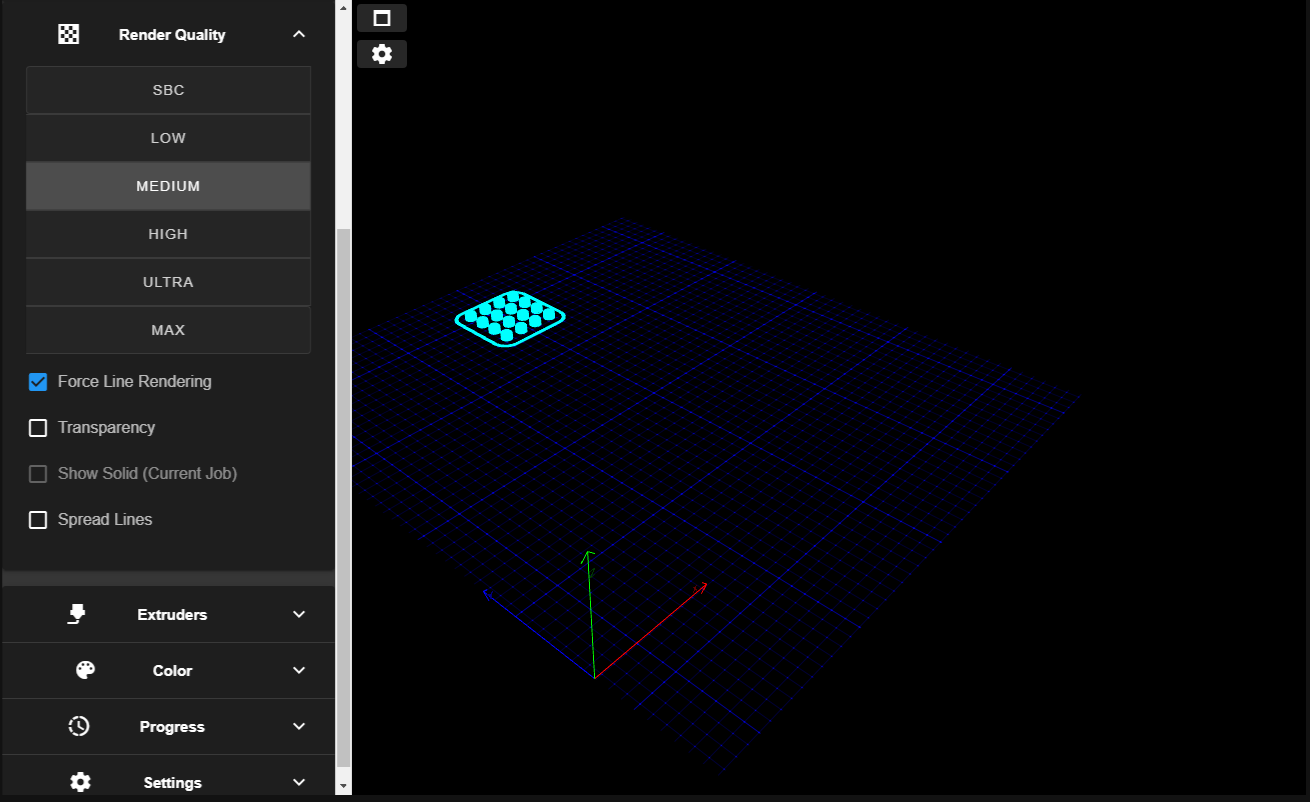
Ah, finally, visible weird behaviour. That might help troubleshooting?After loading G-code:

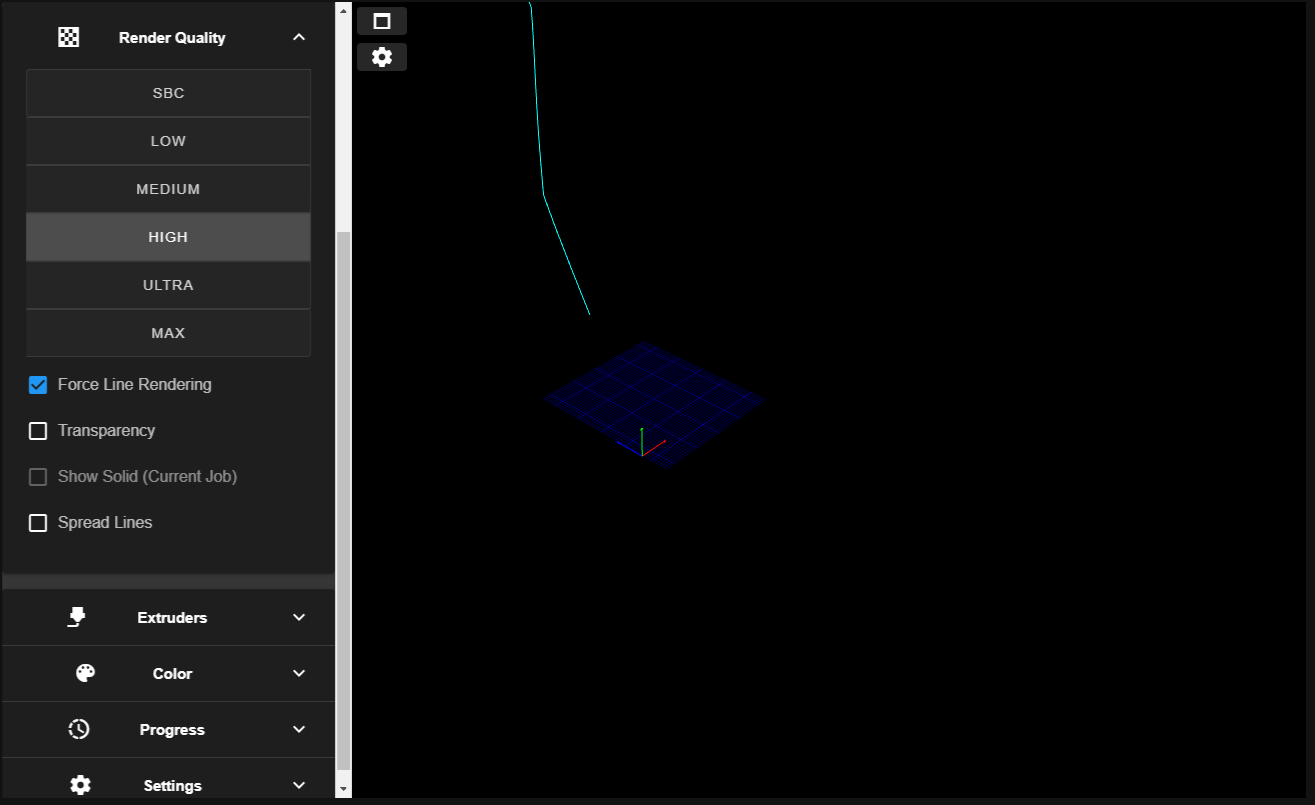
And then after pressing the render quality->high button and waiting for the plugin to rebuild the scene:

Verified slicer influence: both PrusaSlicer and Cura generated G-code behaves equal.
-
@the_dragonlord the tools are fixed on the viewer at the moment. An artifact from when the viewer did not talk to the dwc. This tool was originally designed for previewing multi-material prints.
-
@DaBit I am going to try a few things here. Which version of the viewer are you using?
-
@Sindarius so the problems I have experienced should be DWC's fault? Maybe the beta version isn't stable enough? Have anyone else here noticed connection issue with the DWC?
-
@Sindarius : version 0.9.3, DWC 3.2.0-beta4, RRF 3.2-beta4 on a Duet2Wifi
I also deleted the contents of the www/ directory on the SD card, put a fresh copy of DWC into it and reinstalled the plugin to make sure no interfering history was left.Browsers tried are Chrome version 86.0.4240.128 and Edge (version euhhh..) on Windows 10, NVidia RTX2070 graphics card and the Chrome browser on my Android 7 smartphone.
-
@the_dragonlord By chance did you remove my plugin just to make sure it's not anything I am doing?
-
@DaBit Just by sheer curiosity have you tried on max render setting and when you see that line zoom way out? This really has me stumped because I have never seen that behavior.
-
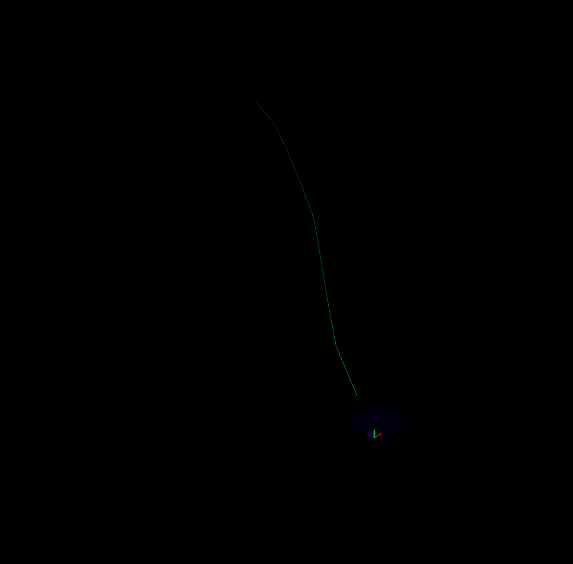
It seems to end and not continue in height above the bed indefinitely:

-
@Sindarius said in 3D GCode Viewer integrated with DWC:
@the_dragonlord By chance did you remove my plugin just to make sure it's not anything I am doing?
no because I urgently needed the printer and I had no time to make a try, I've downgraded the whole... tomorrow I will give it a try... but I'm sure that yesterday DWC was sooooo slow to connect even before I installed your plugin
-
@DaBit that’s pretty cool! I am stumped on that one. I am putting together a build that will turn on some debug tools and maybe help us figure out what is going on.
-
Let me know how I can help!
-
@DaBit I added a debug version which is going to throw a lot of stuff to the console and show some debug tools in the UI.
What would help me is after you refresh and the first load works clear out the browser debug console and hit "reload view" Mainly I am looking to make sure the gcode line count remains the same and that meshes are actually loading. You may want to try a slightly larger model in medium+ render setting to make sure several meshes get rendered.
https://github.com/Sindarius/DWC_GCodeViewer_Plugin/releases/tag/0.9.4
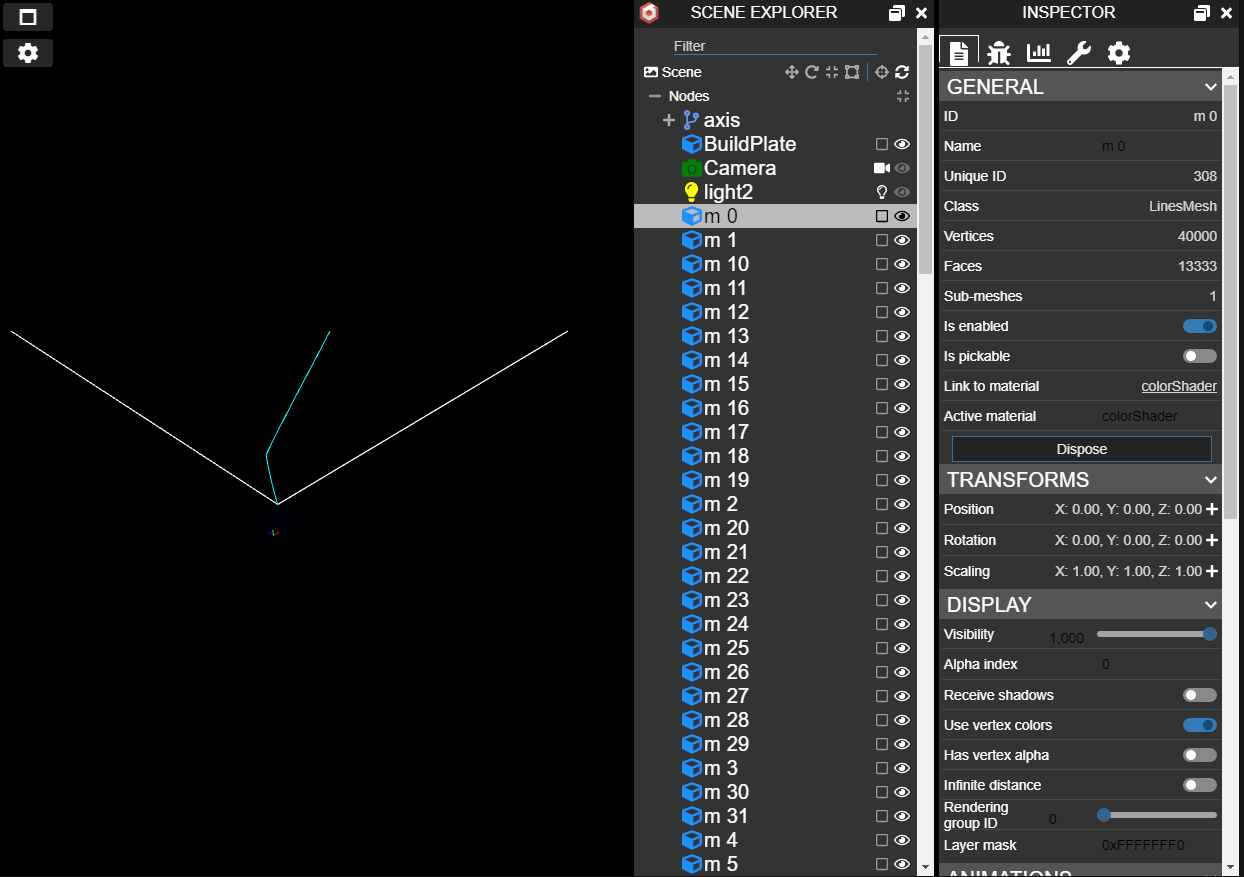
It should look something like this


-
A larger file, 19MB of Gcode:

After hitting Reload View:

I do get the same 32 meshes and line number.
Mesh 0 is the only one shat shows some form of a boundary box when I click the checkbox in the scene explorer.

(on first load I see every mesh containing a slice of the model)
Can I see the data in the vertexarrays somewhere? OpenGL has been some time ago for me, but I have a gut feeling something goes wrong when filling those.
-
@DaBit It's almost like your points rendering to a massive scale or off into the nether. What is confusing is it renders the first time. Looking at the last picture the axes for the bed are very tiny which means the scale of that boundary is massive. I use PrusaSlicer for a majority of my prints and haven't seen this before. Have you updated your video drivers? At this point maybe getting your printer's config and sample gcode may be necessary to solve this. You're the only person I am aware off having problem and you're seeing it on both desktop and mobile.
If you can make an issue on github and attach supporting files that may help me get down to the bottom of this.
-
Yes, graphics driver is recent. That is the first thing I update when encountering display issues in software.
(it never ever resolved them though )
) -
@DaBit You can go to the tools in the inspector tab and export a babylon file. That will export all of the meshes vertices to a file and you can look at them. may show if they are really wrong.
Edit : Thanks for sharing your gcode file. I was able to recreate the issue by using your gcode.